
Webinar
Online
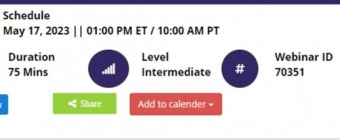
How to Use Microsoft Excel Pivot Tables to Easily Summarize and Analyze Data
By
ConcordEducations
0 Followers
Follow
Event Details
How to Use Microsoft Excel Pivot Tables to Easily Summarize and Analyze Data
PivotTables can help you sort and sift through large data sets to focus quickly on just the data elements that matter most to your specific needs.
In just one fast-paced and informative training session, you'll learn how to use PivotTables to sort your data more efficiently, create multiple customized reports in a few easy steps and gain a powerful new tool to help you make better business decisions.
In addition, you'll get tips on the easiest way to group your data. Most importantly, when you use the power of PivotTables, you'll be saving time and making your job easier.
Why Should You Attend
Attend the webinar to get an in-depth knowledge of PivotTables, including how the tool helps in making customized reports and how it helps in making better business decisions.
Objectives of the Presentation
» Create PivotTables and modify their structure
» Filter and Sort the data in a PivotTable
» Change the PivotTable calculations
» Show pivoted data in terms of percentages
» Refresh the PivotTable based on changes in the original database
» Group date fields to view the data over different time periods
» Format a PivotTable
» Drill down to the source of data from a PivotTable
» Use Slicers to make filtering a PivotTable simple
» Create a PivotChart to see the data visually
Areas Covered in the Session
» Why PivotTables are the hidden gems of Excel
» How to analyze large data sets from different business perspectives
» Create a PivotTable to summarize data
» Make understanding the data easier for others
» Use PivotTables to answer questions about the data
» Analyze patterns in the data
» Customize the summary by grouping data
» Format PivotTables for easy viewing
» Use a chart to view the summary visually
Who Will Benefit
» Business Owners
» CEO's / CFO's / CTO's
» Managers
» Accountants
» CPA's
» Financial Consultants
» IT Professionals
» Auditors
» Human Resource Personnel
» Bookkeepers
» Marketers
» Anybody with large amounts of Data
» Anybody who uses Microsoft Excel on a regular basis, and wants to be more efficient and productive
To Register (or) for more details please click on this below link:
https://bit.ly/452dGAo/a>
Email: [email protected]
Tel: (989)341-8773
Entry Fees
Free Registration
Categories
Event Frequency
Weekly
Event Timings
(GMT-4:00) Eastern Time (US and Canada)
01:00 PM - 10:00 AM (May 15, May 16, May 17) (Business)
Organizer

ConcordEducations
0 Followers
Follow
"You’ll learn to use a prescribed, six-step model that will raise the odds your disagreements with others will be productive without fracturing your relationships."
Comments on How to Use Microsoft Excel Pivot Tables to Easily Summarize and Analyze Data
You must Login to write a comment.
Peoples Interested in Visit
0 Peoples Interested to Visit
Event Location
Official Link :
Featured Event
Please Wait...
Please Wait...
Similar Events

07
Aug
2023
Free
Webinar